
West Coast Trail


West Coast Trail Tides
Hiking the West Coast Trail means navigating tide-restricted sections of beach that are only passable below specific tide heights.
At orientation, Parks Canada will give hikers a paper map showing the restrictions marked on the West Coast Trail Map together with a very basic high-low
tide chart
for the days of your hike.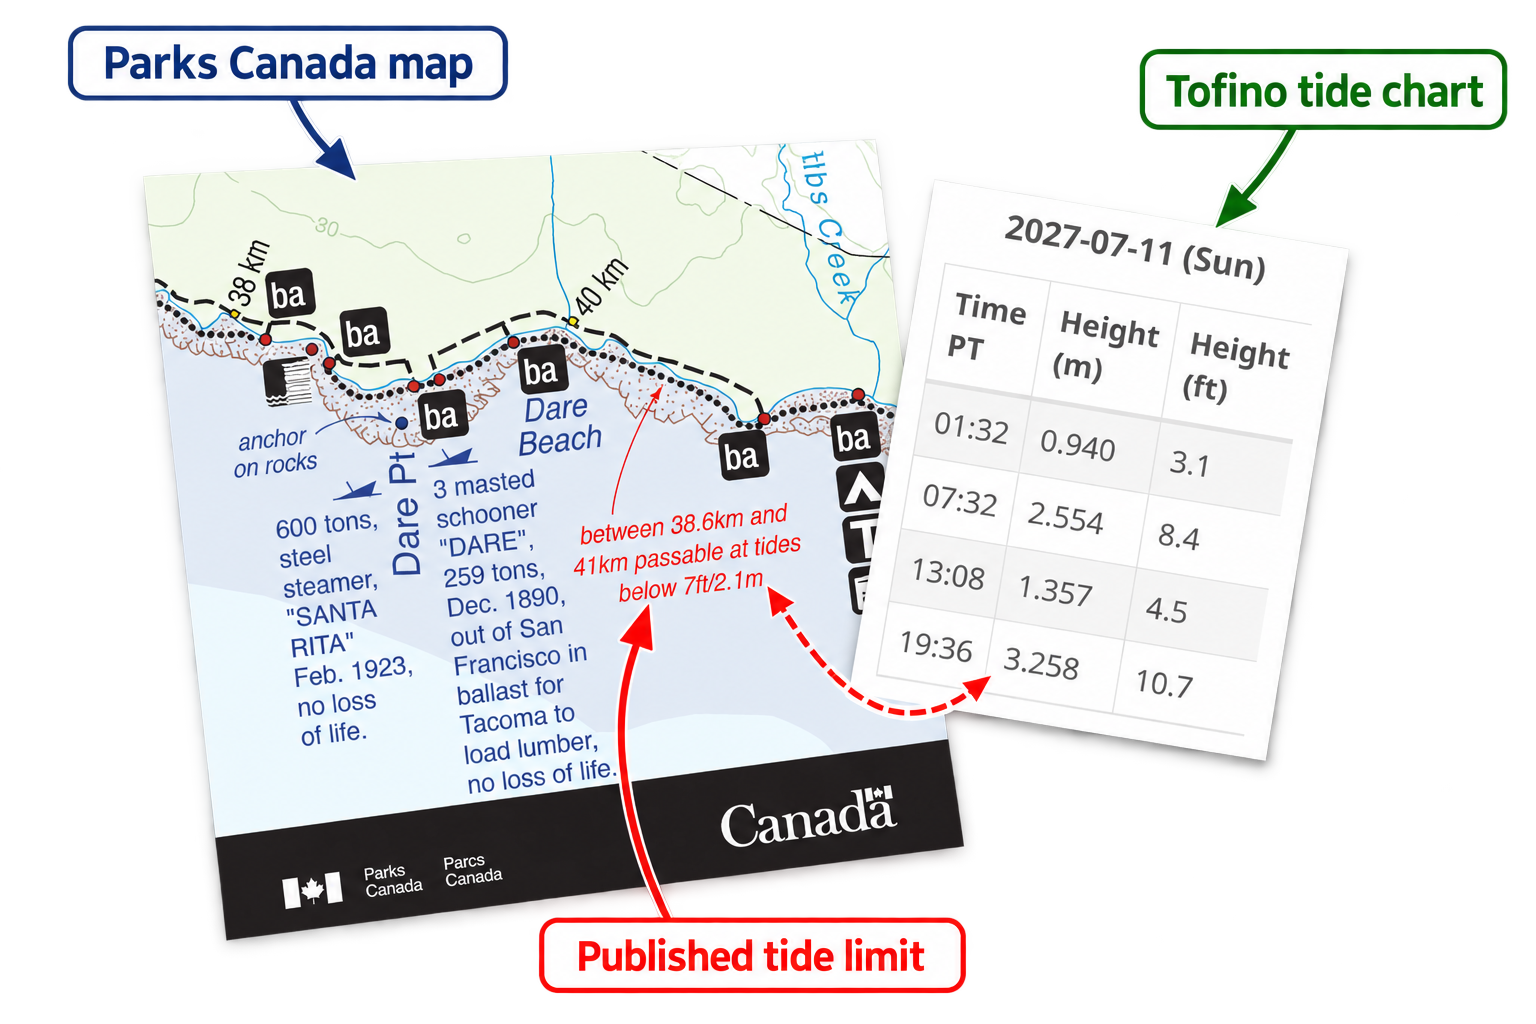
Experienced coastal hikers know that a full tide chart gives you much more control over the day. It can mean the difference between timing a safe beach passage and being forced onto the forest route.
Time the tides with confidence
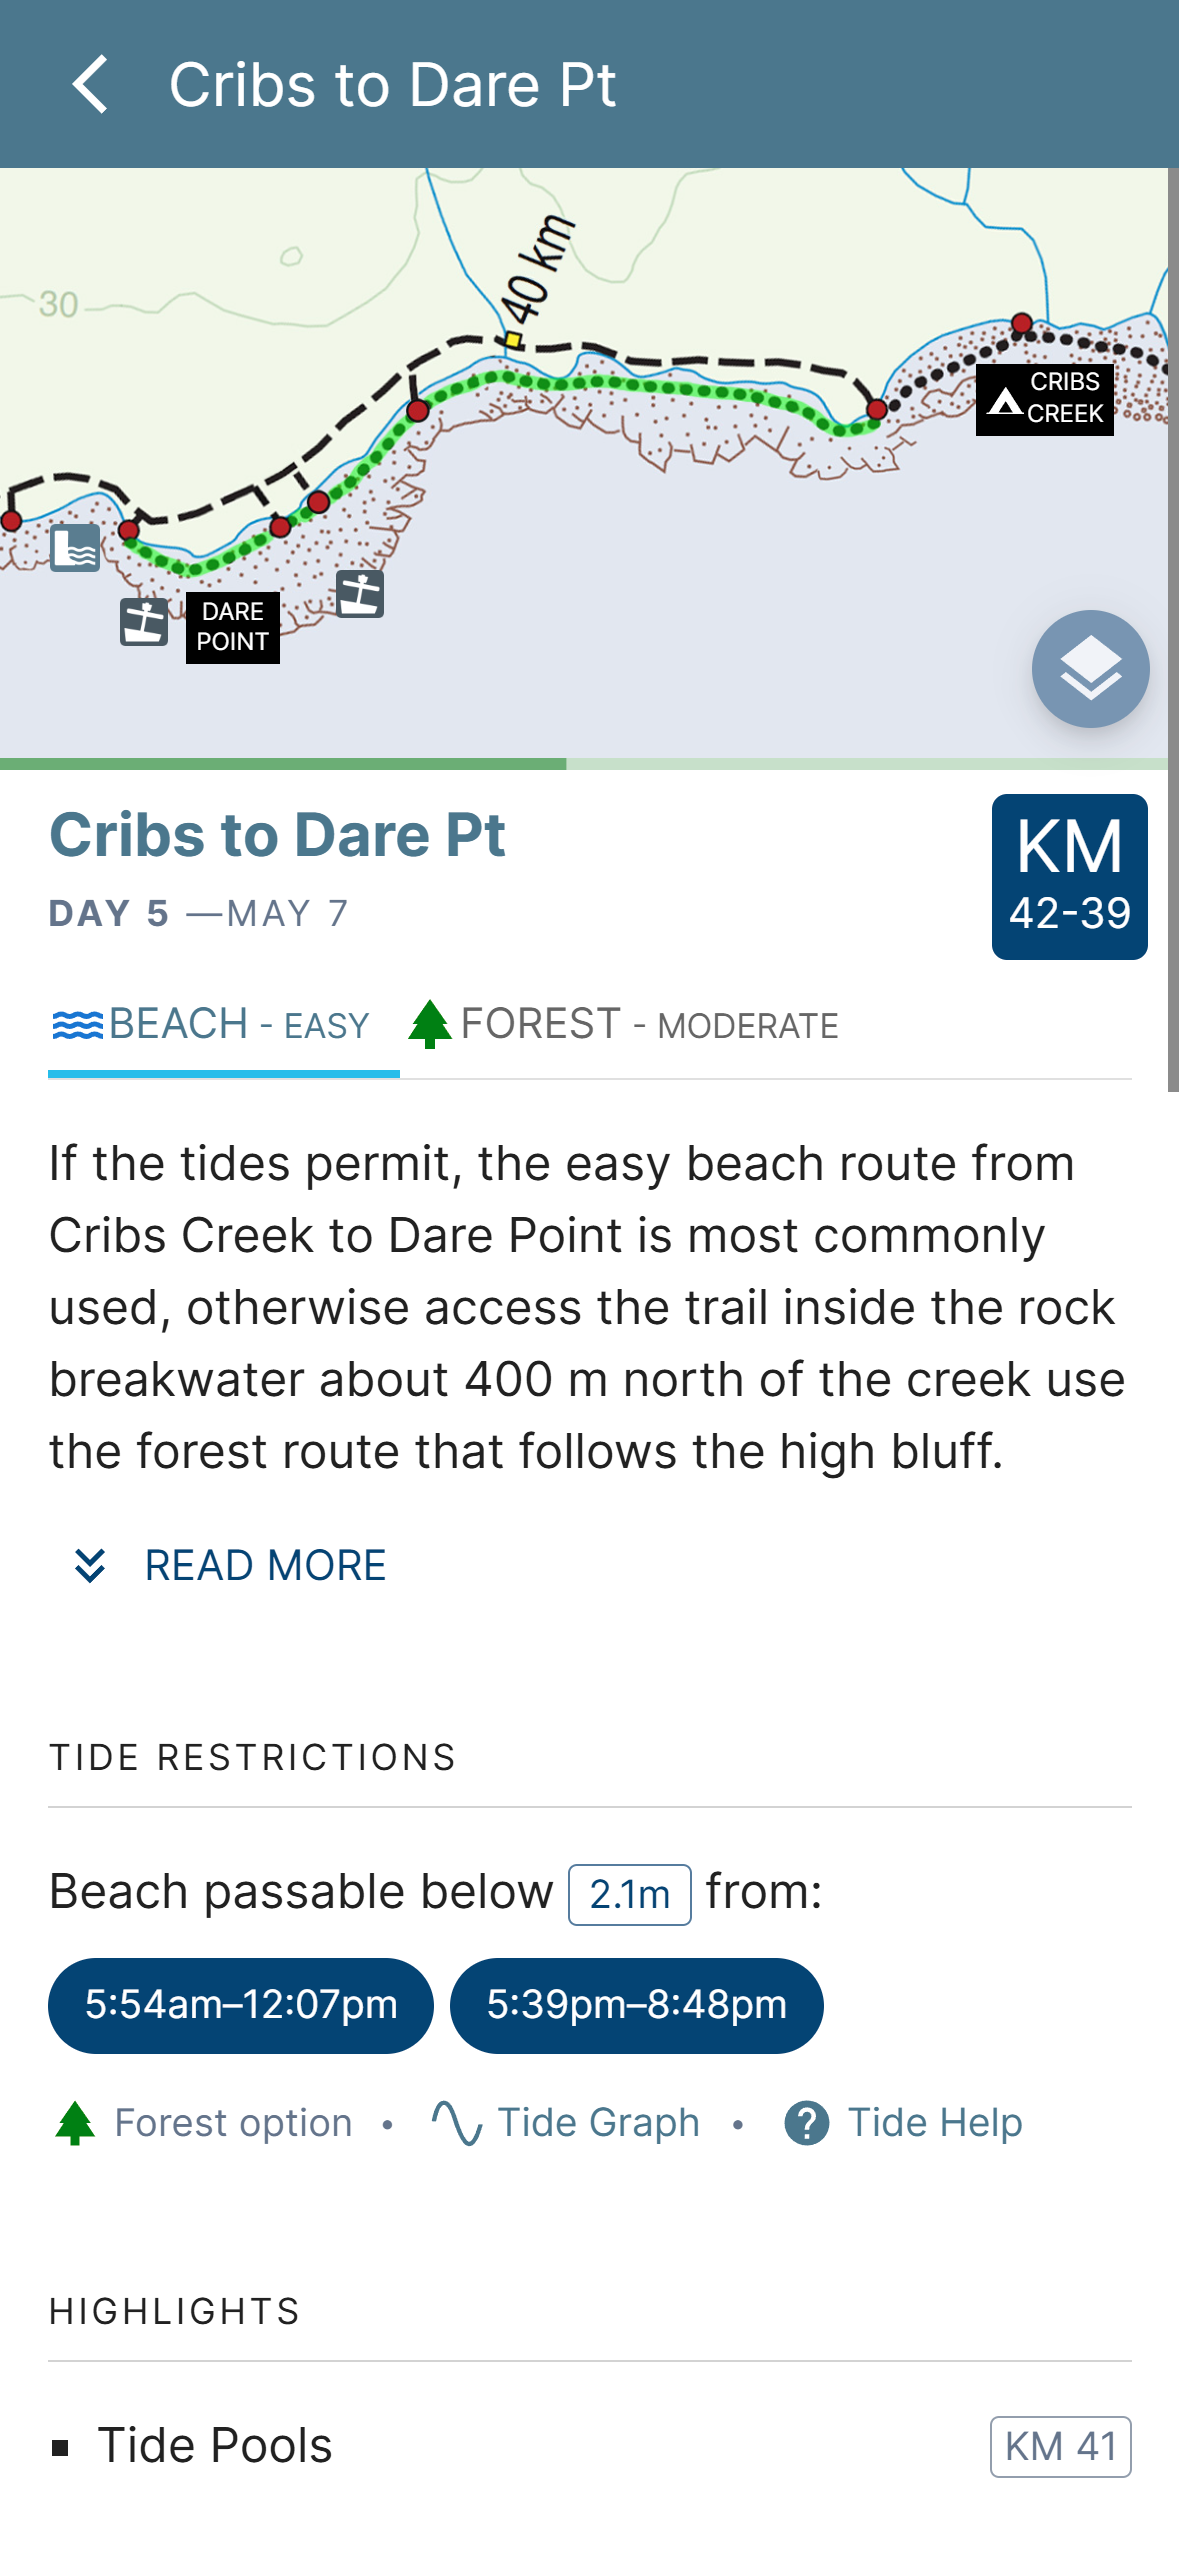
West Coast Trail shows tide-restricted beach trail in a green highlight, so you can easily recognize where tides matter.
Basic tide tables only show the highs and lows. Crossing with confidence means digging into full tide charts and calculating safe passage times by hand.
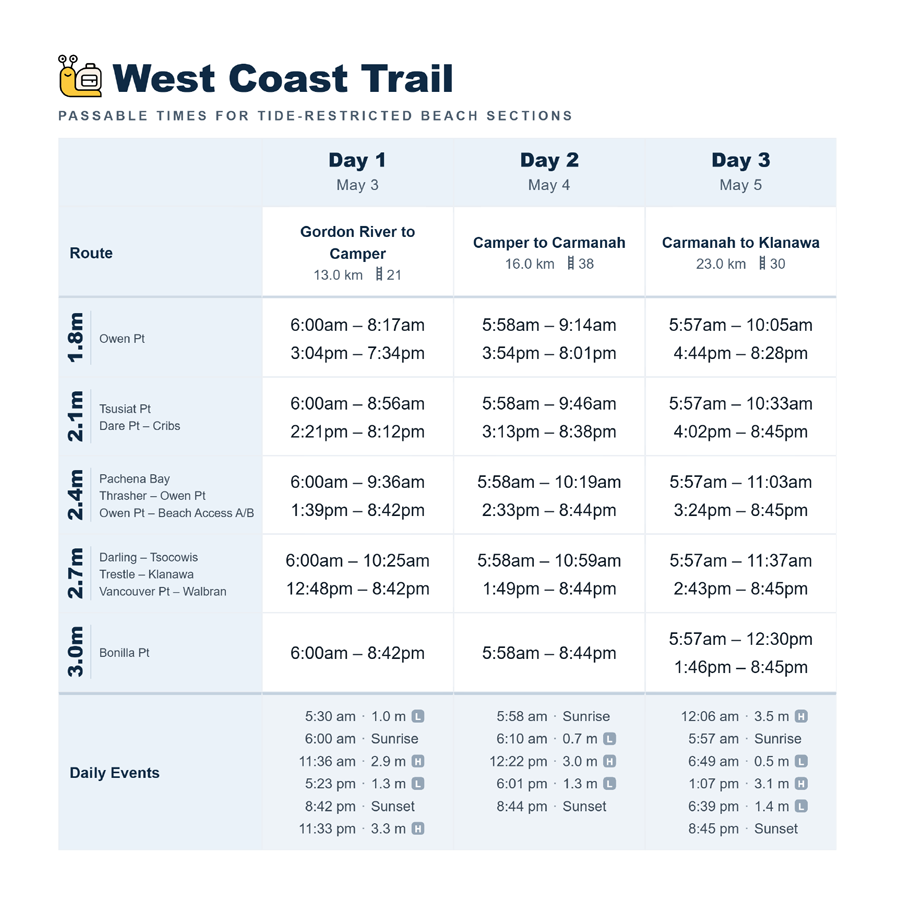
West Coast Trail does complicated tide math for you — presenting each restriction as simple passable time windows.
And because your itinerary is already built into the app, those windows are calculated for the actual day you’ll reach that section.
Be tide-aware when hiking
While you’re hiking, West Coast Trail puts the current tide right on the navigation map.
At a glance, the Tide Control shows the current tide height, whether it’s rising or falling, and how high it is relative to the day’s high.
Tap it for the full picture: your current position on the tide curve, plus the next high and low with their predicted times and heights.
Knowing where the tide is and where it’s going helps you make safer decisions when choosing between beach and forest routes.
See the Tide Cycle
Sometimes you want to to see what the tide is actually doing.
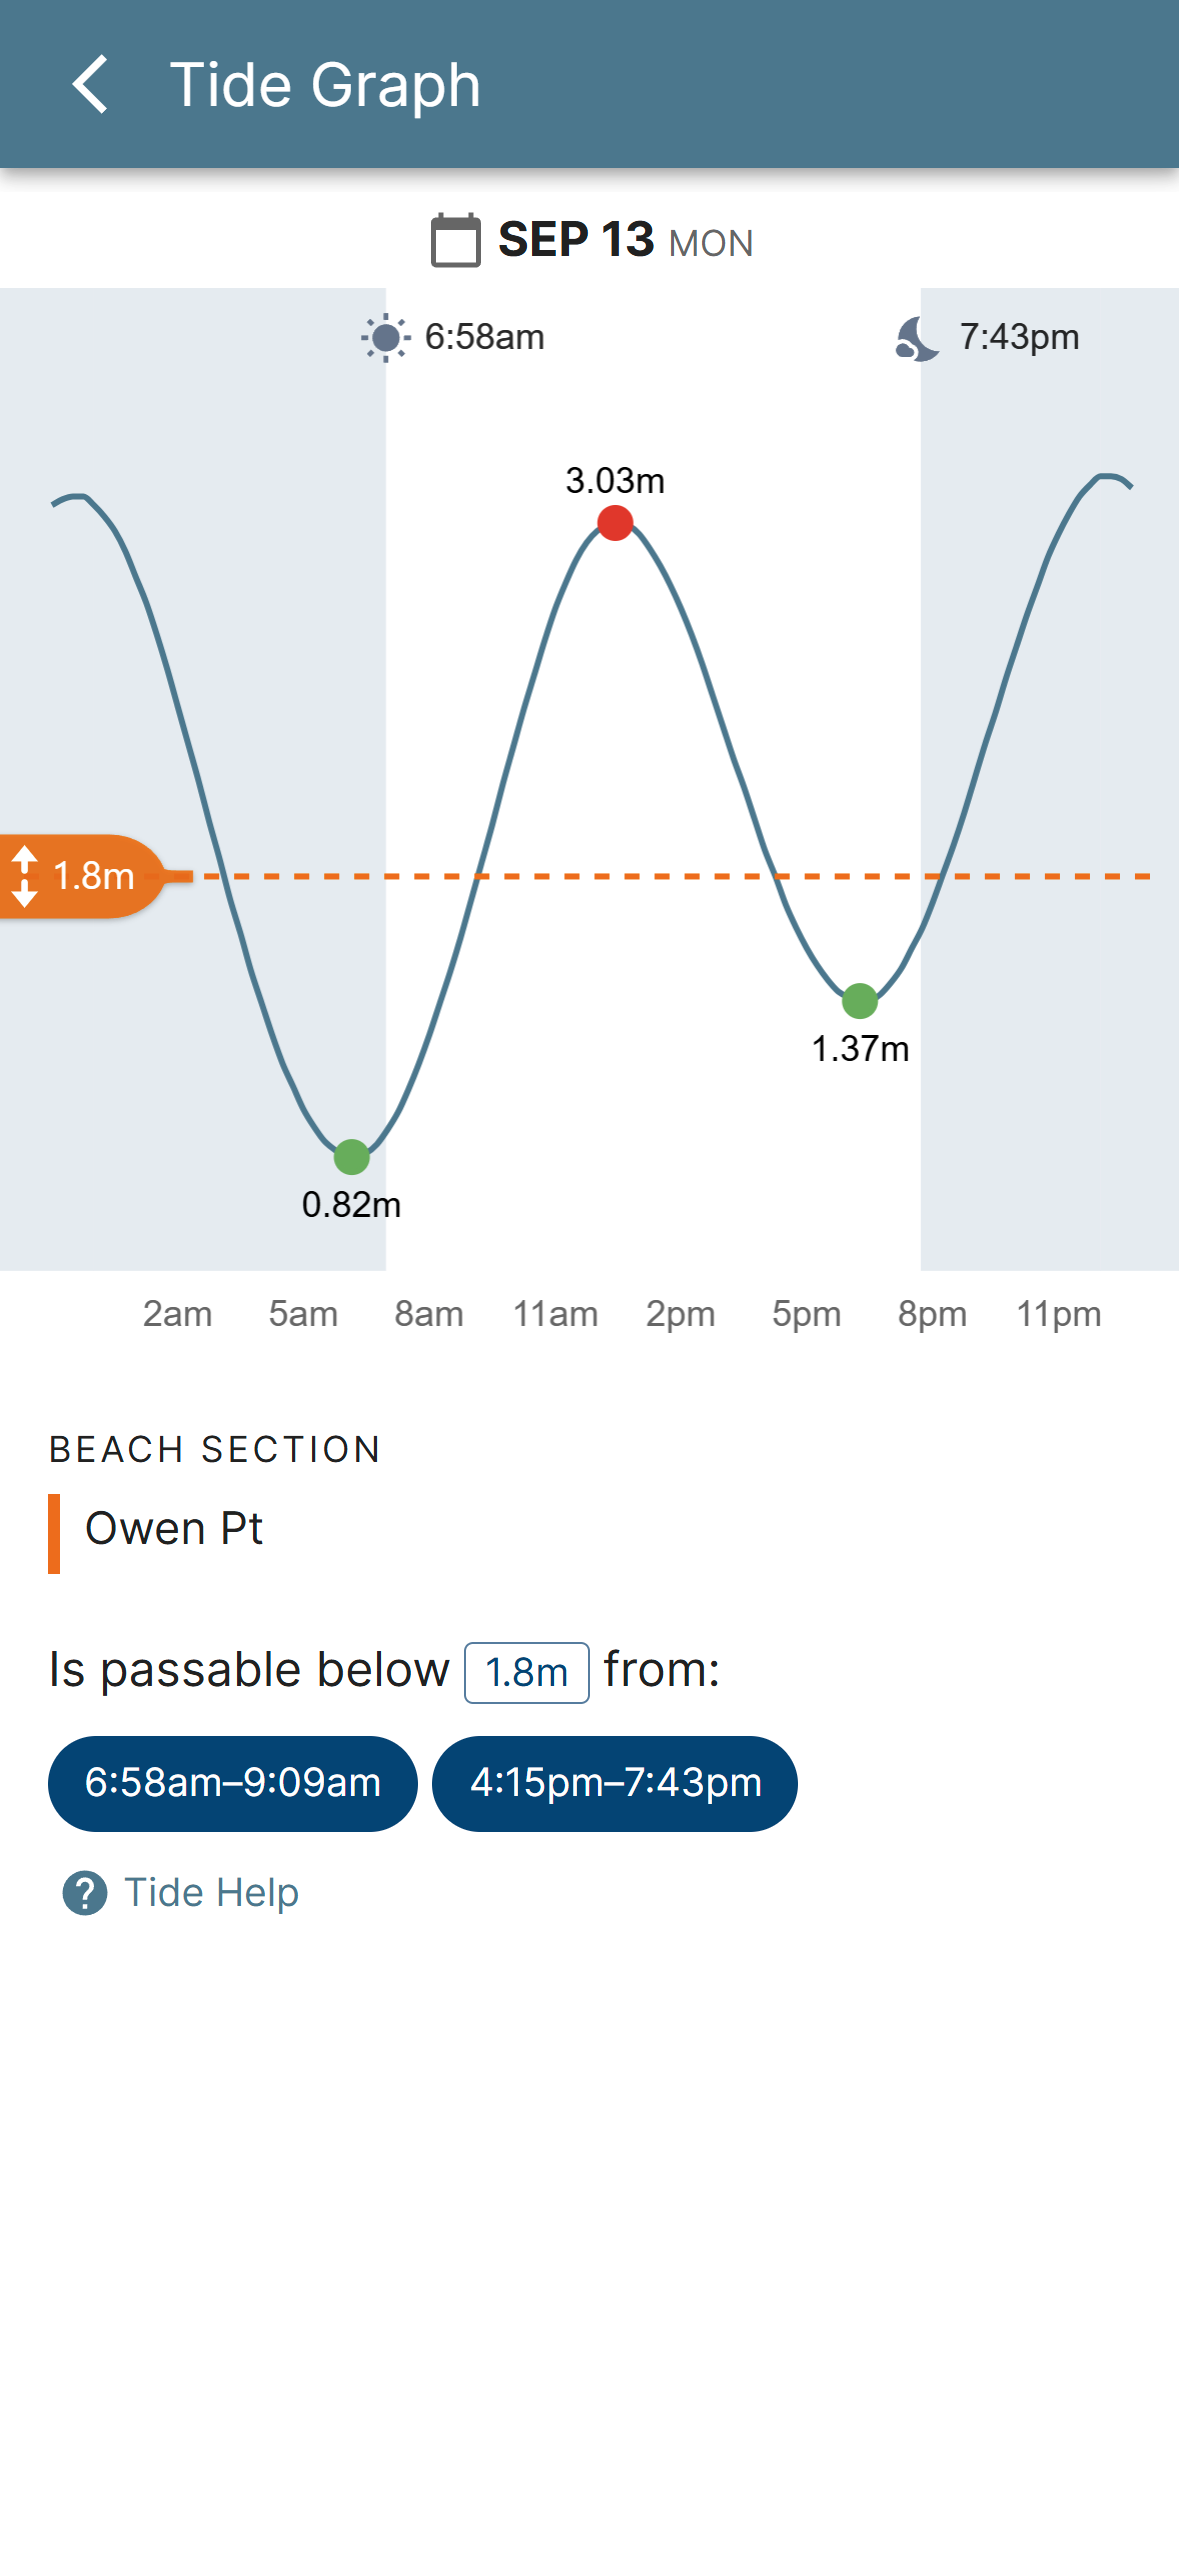
The Tide Graph shows the full cycle behind those passable windows, making it easy to see how long a window lasts and how quickly the tide is moving.
You can also compare any West Coast Trail tide limit against the curve, making it easy to see exactly where that restriction sits in the day’s tide cycle.
Safe passage of Owen Point
Owen Point is one of the highlights of the West Coast Trail — and one of its most complicated tide problems.
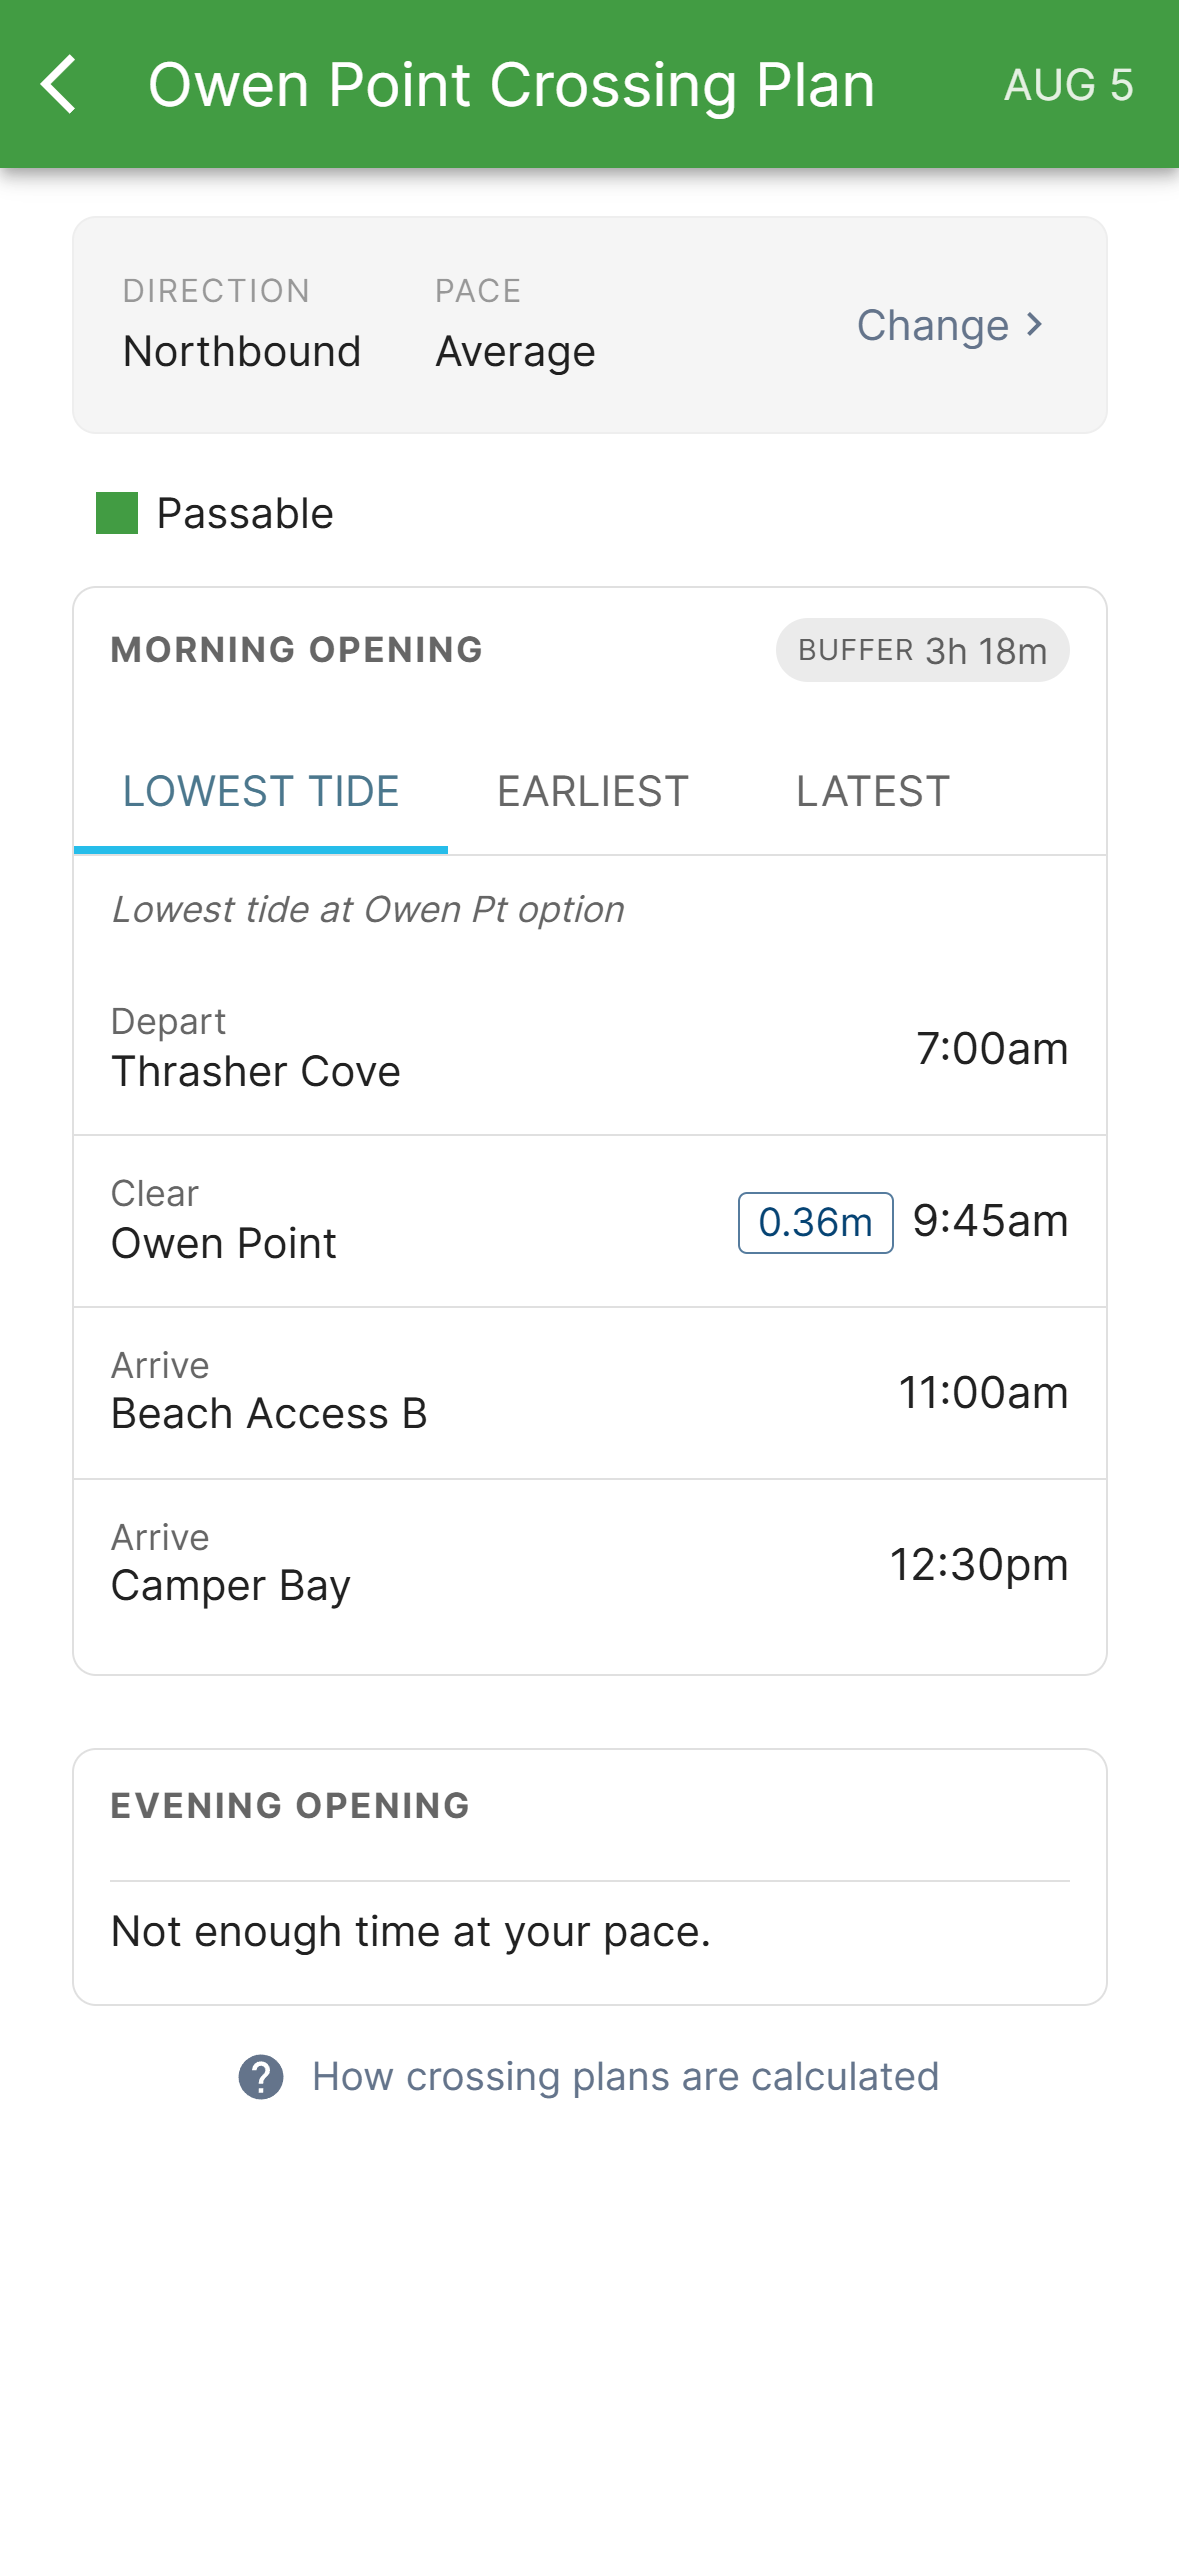
It’s a multi-hour crossing over complex beach terrain: slippery boulders, large surge channels and sandstone shelves. The approach and exit require tides below 2.4 m, while the caves themselves require tides below 1.8 m.
Owen Point is a major hotspot for search-and-rescue evacuations on the trail. Timing it safely is hard, and it’s easy to get wrong.
West Coast Trail does the math for you, using your group’s direction and estimated hiking pace to build different crossing plans you can be confident in.
Have a backup plan
The West Coast Trail is no place to rely on a single screen. Phones die, batteries drain, screens crack. Bring a paper backup.
West Coast Trail lets you print a backup tide plan built around your itinerary, including passable windows, daily highs and lows, daylight and extra days in case your schedule changes.
Take the Tides With You
Get passable windows, Owen Point crossing plans, the Tide Graph, and printable tide plans — plus the full interactive West Coast Trail map.